
 This report attempts to assemble and analyse useful sources to determine how many people identify outside of the gender binary in the United Kingdom. This was in part motivated by my previous post reporting on the number of people who left the ‘sex’ question on the 2001 UK Census blank, having been cited as a figure representing how many people are not female or male in this country. I’ve chosen to focus on the UK in this follow-up post as I’m most familiar with organisations and activists based in this country, but if anyone has similar figures relating to other countries or which are more general, such as covering entire continents, then please do share them, and any corrections, in the comments.
For the purposes of this report, I am defining ‘nonbinary’ as an umbrella term for any gender (or lack of gender) that would not be adequately represented by an either/or choice between ‘man’ or ‘woman’. There is a large diversity of different experiences and identity labels that meet this definition. It is intended that all are included.
As is often the case with surveys and censuses, the presentation and wording of a question is extremely important factor in how people answer it (see for example, the controversy over how the question of religion was presented in the UK Census). If you wish to measure the numbers of people who don’t fit within binary classifications of female/male or man/woman then your choice of question will have a huge effect on the results. As such, this post will attempt where possible to report on how the gender questions were asked rather than just how they were answered.
Please note that I am not a statistician, but wherever possible the figures are sourced directly from research papers, within which full methodologies and statistical analyses are available. It is recognised that some of the surveys presented have limited value due to poor methodology or due to applying to different populations. Flaws and limitations have been described when identified. Some surveys are included to present missed opportunities, provide constructive criticism or to demonstrate wider community trends that may relate to the UK population.
Abstract
Reliable figures show that at least 0.4% of the UK population defines as nonbinary when given a 3-way choice in terms of female, male or another description. That’s about 1 in every 250 people. The proportion will likely be higher when the question is phrased in terms of man/woman or when multiple choices are allowed, as is shown in studies of trans and asexual populations.
Identities and experiences under the nonbinary umbrella are extremely diverse with many identifying with multiple labels. Only around 31% of nonbinary people confidently identify as trans and more than 65% are not protected by the Equality Act 2010 gender identity provisions. Surveys of trans communities found around 25 to 28% identify in some way outside of the binary.
It’s important to present your gender question in an inclusive way to help nonbinary people feel welcome to describe themselves as something other than men and women. Consultation with nonbinary, genderqueer and trans etc communities is recommended when designing surveys.
If gender is asked in terms of frequency of feeling like a man, a women, both or neither then there is evidence that more than a third of everyone may experience gender in a way that defies binary categories.
More research on nonbinary people is needed.
Contents
- Surveys of the UK general population
- Surveys of the UK trans population
- Surveys of other populations
- Summary, analysis and recommendations
Surveys of the UK general population
Ideally our survey sample should be as large as possible, or should at least be designed in such a way as to produce a result that is a valid representation of the UK’s population, with a significant randomised sampling.
The United Kingdom Census 2011
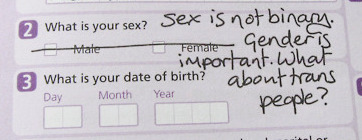 Although the census has, by its nature, the largest possible sample, it asks the question of gender (or in this case ‘sex’) in the worst possible way if the aim is to record whether people aren’t described well by categories like ‘female’ or ‘male’, or ‘man’ or ‘woman’:
[2] What is your sex?
□ Male □ Female
This appeared within a demographics section between name and birth date, which both leads the reader to believe that they’re being asked for their ‘legal sex’ or the gender they were assigned at birth and offers no recognition that there can be any other options than the binary choice presented, nor space to write in a different option.
Despite this, some people did tick both boxes provided, leave both boxes empty or write something over the question on the form. The Office for National Statistics doesn’t publish counts of how many people explicitly indicated a nonbinary gender when ‘spoiling’ the question in this way (and won’t release scans of the forms for 100 years); however, there are figures for ‘non-responses’ covering all three of these possibilities and a figure for ‘multi-ticks’ indicating how many people ticked both options.
The same ‘Response and imputation rates’ report that showed a 0.4% non-response rate for ‘Sex’ in the 2001 UK Census has been released for the 2011 Census. This again found that 0.4% of Census respondents failed to give a binary response to ‘Sex’ in some way, which now accounts for 224,632 people.
It is interesting that this figure hasn’t reduced given that the 2011 UK Census heavily encouraged users to complete the census form using the Internet, with this web-based system refusing to allow entry of the census questions to continue until a single binary answer was given. It was reasonable to expect a noticeable drop in the rate, which hasn’t occurred. However, a non-response rate of 0.4% is still the lowest of all census questions with Age receiving 0.6% non-response and Marital / Civil Partnership status 3.8% non-response. Most questions range from 2 to 5% non-response with the highest being over 18%.
What has reduced is the proportion of multi-ticks recorded for ‘Sex’. In 2001 multi-ticks accounted for ~14,000 people compared to ~185,000 who answered neither (or wrote over the question). In 2011 only 4,689 people multi-ticked compared to 224,632 recorded as ‘non-response’ (this figure apparently includes multi-ticks). That’s now 2.1% of all ‘sex’ non-responses being due to both options being ticked compared to 7.0% of them in 2001. Does this mean more people wrote in responses instead or that fewer people identify as both female and male? We have no way to tell.
While it’s interesting to compare these figures and speculate about their meaning, we shouldn’t attempt to put too much significance in the UK Census Sex ‘non-response’ and multi-tick rates. We have no way to tell what non-responses were meant to indicate and, while multi-ticks seem a clear indicator of a gender that doesn’t fit the binary options presented, we have no way of knowing what proportion of people who felt erased by the question opted to make an explicit protest or correction (especially when write ins are not recorded in any way).
On top of all this, it was impossible to answer anything but a single binary option on the online version of the form and the wording of the question and its position in the form means that the fact that some people leave the ‘sex’ question blank or ‘spoil’ the question by writing over this space on the paper form cannot be in any way taken as an indicator of the numbers of people who would’ve answered outside of the binary if given more encouragement to do so.
Equality and Human Rights Commission: Measuring Gender Identity 2011/12
![]() The Equality and Human Rights Commission (EHRC) was formed to challenge discrimination and promote human rights in the UK. Part of its role is to monitor and advocate for the protected characteristics covered by the Equality Act 2010. One of which is ‘Gender Reassignment’, with the Act protecting anyone who intends to undergo, has undergone or is undergoing any part of this process (with no requirement for a medical diagnosis).
The Equality and Human Rights Commission (EHRC) was formed to challenge discrimination and promote human rights in the UK. Part of its role is to monitor and advocate for the protected characteristics covered by the Equality Act 2010. One of which is ‘Gender Reassignment’, with the Act protecting anyone who intends to undergo, has undergone or is undergoing any part of this process (with no requirement for a medical diagnosis).
In 2010, the EHRC found that the Office for National Statistics’ figures were inadequate for reporting on the numbers of people in the UK who qualified for this protection. The Commission also considered that there was no adequate equalities monitoring question for transgender and gender identity, when this would now be a requirement under the new public authorities Equality Duty. It was important to have a standardised question or set of questions that had been used in major national surveys, in order to provide an existing baseline for future Equality Duty monitoring questions to be analysed against.
They set about designing questions to be inclusive of all types of trans people, and not exclude any by using questions such as ‘Is your gender identity the same as the gender you were assigned at birth?’ or ‘Do you live and work full-time in the gender role opposite to that assigned at birth?’. They reviewed, trialled and sought feedback on questions in order to ensure this.
The set of questions that were ultimately selected are as follows:
Q1 At birth, were you described as….
Please tick one option
Male □
Female □
Intersex □
I prefer not to say □Q2 Which of the following describes how you think of yourself?
Please tick one option
Male □
Female □
In another way: □________________________Q3 Have you gone through any part of a process (including thoughts or actions) to change from the sex you were described as at birth to the gender you identify with, or do you intend to?
(This could include changing your name, wearing different clothes, taking hormones or having gender reassignment surgery).
Yes □ -> Please go to Q4
No □ -> ENDQ4 Continuing to think about these examples, which of the following options best applies to you?
Please tick one option
I am thinking about going through this process □
I am currently going through this process □
I have already been through this process □
I have been through this process, then changed back □
None of the above □_______________
I prefer not to say □

Q5 Which of the following describes how you think of yourself?
Tick all that apply
Trans man □
Trans woman □
Transsexual person □
Gender variant person □
Cross dressing/ transvestite person □
Intersex person □
In another way □_______________________
I prefer not to say □

[Note, I do not support asking for gender assigned at birth on Equality Duty monitoring questions, but am glad that ‘I prefer not to say’ has at least been included in the recommended questions. I would instead recommend making it clear that questions are asking for identity and not for body configuration or legal status.]
In 2011, these questions were used in a major national self-completion survey, performed online. In total 10,039 responses were recorded for this research, after a drop-out rate of only 0.2%. Respondents were sampled so as to be representative of the UK population. The results, released as a ‘Technical Note’ in Spring 2012, found that 38 of these respondents answered question 2 such that they “think of themselves in another way than ‘Male’ or ‘Female'”. This accounts for 0.4% of the respondents (it’s probably a coincidence that this matches the figures for ‘sex’ non-response from the last two censuses.)
The report indicates the following:
Further information about those answering ‘in another way’ at question 2 is available through the write-in answers that some respondents provided. These are varied and include: transgender, genderqueer, gender-fluid, some combination of male and female, gender neutral, genderless, a person, human, normal, androgyne and neither/none.
Barring the ‘normal’ response, which is somewhat ambiguous, this seems to indicate that it’s reasonable to take the ‘in another way’ answers as indicating a nonbinary experience of gender.
This research was designed to be statistically significant and to be used as the baseline for analysis of Equality Duty monitoring questions, so it’s therefore reasonable to use the results as indicative that approximately 0.4% of the UK population identifies themselves in another way than the gender binary options of female and male.
A breakdown of the other questions was provided allowing question 2 to be compared to questions 1 and 3 (extracted from the full Annex B breakdown, with added totals):
| Think of yourself as (Q2) | Described at birth as (Q1) | Number of responses | Percent of total | Gender reassignment protected characteristic (Q3) | Percent ‘yes’ to Q3 | ||
|---|---|---|---|---|---|---|---|
| Yes | No | Missing | |||||
| In another way | Male | 18 | 0.2% | 8 | 10 | 0 | 44.4% |
| Female | 17 | 0.2% | 4 | 13 | 0 | 23.5% | |
| Prefer not to specify | 3 | 0.0% | 0 | 2 | 1 | 0.0% | |
| Total | 38 | 0.4% | 12 | 25 | 1 | 31.6% | |
31.6% of those who gave the ‘think of yourself in another way’ answer indicated that they were considering, were undergoing or had undergone some part of gender reassignment (answered ‘Yes’ to question 3). There was an almost equal split in the ‘birth sex’ question for the ‘another way’ group with 17 indicating female at birth, 18 indicating male at birth and 3 preferring not to say (respondents had also previously been categorised with a binary gender question, this split the ‘another way’ responses into equal sized groups). Within the question 1 assignment at birth split, twice as many who indicated that they had been assigned male at birth answered ‘Yes’ to question 3 (gender reassignment) than those who indicated that they had been assigned female at birth. Of the ‘Prefer not to say’ group, 2 answered ‘No’ to question 3 and 1 skipped the question.
For comparison, 1% of the research population (100 respondents) answered ‘Yes’ to question 3 (relating to an Equality Act 2010 definition of the ‘Gender Reassignment’ protected characteristic), and 0.03% (4 people) indicated they were intersex (none of whom gave a nonbinary answer to question 2.) The population of intersex people responding to the survey is too low to be able to extrapolate proportions of intersex people who also identify their gender ‘in another way’, but we are able to say that 12% of people who qualify for Equality Act 2010 ‘Gender Reassignment’ protected characteristic identify outside of the binary and that more than 65% of nonbinary people do not fall under the Equality Act’s protections for gender minorities.
There are a number of reasons why some nonbinary people might not be able to identify with the ‘gender reassignment’ protected characteristic description as presented. They may be alienated by the wording including ‘change’ ‘sex’ and assume this cannot apply to them, especially if they are comfortable with their body but not the gender they have been assigned. They may feel that there is no ‘process’ required to express their gender, it may be something they feel is done simply by being themself. They may feel that there is no societal role for their gender, and so no way to express this that would be recognised by others. They may have a fluid experience of gender and feel that a ‘process’ implies a permanent or long-term change which would be limiting and inappropriate. They may have a strong experience of having no gender or having a nonbinary gender, but no strong discomfort that would require this to be affirmed through transition. They may feel that their gender nonconformity is an expression of personality, sexuality or something other than gender identity and so may identify with the sex they were assigned at birth (this describes some people who would have nonetheless written ‘genderqueer’ or similar in for question 2). They may also feel that their experience of gender outside the binary is something personal to them and not to be shared with others. (And of course there are a number of equally diverse ways why some nonbinary people do strongly relate to the ‘gender reassignment’ description, up to and including having undergone some form of formal transition and/or transgender medical treatments.)
It should be noted that this report has been cited in various places as demonstrating that 1% of the UK population is transgender or gender variant. However, this 1% figure erases the 26 individuals who indicated that they identify themselves in a way other than female or male but did not relate to the description of ‘gender reassignment’. As such, the EHRC research indicates that 1.3% of the UK population is in some way transgender or gender variant. However, the figure should likely be larger as many of the objections in the previous paragraph could also apply to some binary identified individuals. Within this 1.3% of the population, 30.2% are nonbinary.
These are now the EHRC recommended monitoring questions for public authorities, so it is likely that they will continue to be used in major national surveys and applied to many smaller populations.
YouGov Daily, October 2014
 YouGov is a large polling site offering the promise of a £50 reward to members who answer enough weekly surveys. YouGov polls are often reported as notable in the news and are used to predict the results of upcoming elections or influence public policy. For example, a YouGov poll before the recent Scottish Independence Referendum has been credited for changing the course of the Better Together ‘No’ campaign, resulting in ‘The Vow’ promising more devolved powers to Scotland within the Union.
YouGov has a large membership and selects smaller samples from that membership to pose questions to. Based on YouGov’s published results for website polls (for example, this 2014 poll on attitudes to nudity), samples for individual polls of the UK populations appear to range from 1000 to 2000 respondents. YouGov only appears to ask panel members for a binary gender and does not report on numbers of respondents who are neither men nor women.
YouGov also provides a free polling smartphone app called ‘YouGov Daily’. This asks users 3 questions per day and reports on the results. YouGov describes this app as:
YouGov Daily is a smartphone app for a daily polling experiment. YouGov will use this panel to test ideas and get immediate feedback on polling and the YouGov experience.
Samples for this app’s questions appear to be self-selected, completed by those who choose to install the app (available on Apple’s App Store and Google Play) and answer the questions each day. It’s possible to use this app to answer polls without giving any demographic information, although there is the option to give your ‘Zip/Postcode’ and the details of your YouGov website account.
The web-based YouGov Daily results fail to report sample size or any demographics, such as whether it’s limited to the UK; however, most of the questions are clearly UK-specific. Once the user has answered, total sample size for the current question is given through the app. At the time of writing, Saturday the 6th of December 2014, the YouGov Daily app is asking about BBC political bias, if the BBC should continue to be funded by the licence fee and whether the Elgin Marbles held at the British Museum should be loaned to other countries and/or returned to Greece, all relevant to current UK news stories. As of 16:45, the current total number of respondents was 3,037. On checking again at midnight the total had reached 3,942 and the question continued to be open to responses. Results for the previous day’s questions seem to have been posted a little after 10:15 each morning, so it’s reasonable to assume that sample sizes for YouGov Daily questions are well over 3,000 and are at least in majority British.
On the morning of 22nd of October 2014, YouGov’s UK website posted the results of a 3 question YouGov Daily poll in which respondents had been asked the opening question:
You are either a man or a woman. Agree? Or disagree?
□ Agree
□ Disagree
□ Not sure
It’s likely that this question related to the news stories that week reporting that OKCupid had begun allowing (some) users to indicate additional options for gender and sexuality.
The results of this poll were 74% ‘Agree’ with ‘You are either a man or a woman’, 19% ‘Disagree’ and 7% were ‘Not sure’.
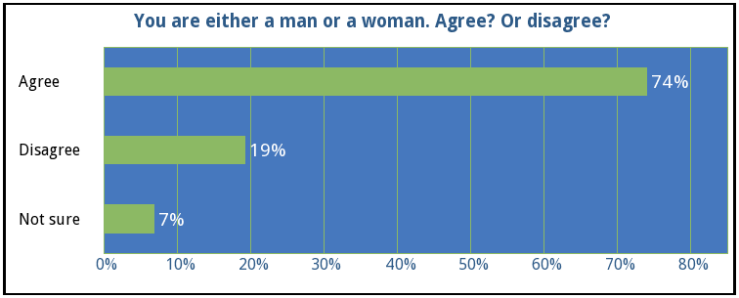
Unfortunately, this was an ambiguously worded question. It could be taken to ask the individual ‘you’ if they are ‘a man or a woman’ or if they are something else, or it could be taken to ask the individual if they believe that it’s possible for any person to be something other than a man or a woman. (Consider, for example, how one might read a question using a similar binary statement ‘You are either gay or straight’ or ‘You are either introvert or extravert’.)
My feeling is that the full stop makes the first part into a statement, not a question, while ‘Agree? Or disagree?’ invites the reader to consider the validity of it as a general statement. The following questions were in fact clearly asking about the individual’s identity, but were not visible until the first question had been answered. Given the much higher figure than the EHRC found, it’s reasonable to assume that most respondents had a similar understanding of the question to mine, although this cannot be said for sure. However, it’s open to enough interpretation that some men or women may have answered ‘disagree’ despite believing in the existence of nonbinary people.
Due to the ambiguous wording, the only reliable conclusion that can be taken from this poll is that at least 19% of active YouGov Daily users believe that it is possible to have an existence outside of the binary categories of man or woman. The real number may in fact be higher.
Based on the YouGov description of the app as a polling experiment that allows them to test ideas, there is a chance that YouGov are considering allowing for the panelists of their main website polls to indicate genders other than Man or Woman in the future.
Surveys of the UK Trans Population
As one might expect, the population that tends to be most often asked about gender in more nuanced ways is the trans community. However, it’s important to remember that more than 65% of the people that the EHRC research above identified as identifying outside of the binary did not identify with even the most general and inclusive wording describing ‘gender reassignment’ and so may be unlikely to be found in trans groups and online communities with a heavy focus on transition.
Although official figures are limited, some trans organisations have performed research on the trans population in order to determine our needs and demographics, and have done so in a way that is inclusive of those within the trans community who do not fit within a binary model of gender.
UK Trans Info: Gender Clinic Figures 2014
 Although UK Trans Info have asked, UK gender clinics are failing to record or report on the number of their service users who hold nonbinary genders (see page 5 – content warning on that report for misgendering by gender clinics) despite acknowledgement in a 2013 DIVA magazine article that they ‘see people from a whole spectrum of gender backgrounds with a wide variety of needs and wishes’. (It should also be noted that many gender clinic service users opt not to reveal their nonbinary identity in fear of being denied treatment).
As such, there are no official figures of the numbers of nonbinary individuals known to trans gender healthcare professionals. The ERHC figures above are the most official source of statistical information relating to nonbinary prevalence.
UK Trans Info have now stopped asking about the genders of gender clinic service users as it is clear that clinics are not recording this information in a meaningful way.
GIRES: Gender Variance In the UK: Prevalence, Incidence, Growth and Geographic Distribution 2009/11
![]() In 2009 the Home Office funded the UK’s most prominent gender identity research charity, GIRES (Gender Identity Research and Education Society), to produce the Gender Variance In the UK: Prevalence, Incidence, Growth and Geographic Distribution report. This was a groundbreaking report at the time and produced valuable evidence for policymakers and service providers.
In 2009 the Home Office funded the UK’s most prominent gender identity research charity, GIRES (Gender Identity Research and Education Society), to produce the Gender Variance In the UK: Prevalence, Incidence, Growth and Geographic Distribution report. This was a groundbreaking report at the time and produced valuable evidence for policymakers and service providers.
Despite the inclusive sounding ‘gender variance’ title, the 2009 GIRES report only mentions ‘genderqueer’ once when introducing ‘the broader transgender group’ in the main report and limits other mentions of gender outside the binary to the glossary section. The majority of the GIRES report talks in terms of trans men, trans women and crossdressers. Estimates of numbers are only supplied for these three groups, with ‘transgender people’ later defined as ‘those who crossdress’. This was sadly typical of the historical state of nonbinary inclusion in UK research where, even 5 years ago, a mention in a footnote or glossary was the best one might hope for. We have come a long way in a short time. However, the 2011 update to this report still states that all those who have undergone medical transition are now either trans women or trans men (I, and others, have been treated by gender clinics while openly nonbinary in this time).
GIRES have greatly improved their nonbinary inclusion in recent years. Their 2011 Trans Community Statement of Need acknowledged and included ‘non or bi-gendered folk’ and their TranzWiki categorises all support groups in terms of whether they provide support for nonbinary people. They currently describe their aims with:
GIRES’ overall aim is to improve substantially the circumstances in which gender nonconforming people live. GIRES upholds the right of all those who do not fit the typical boy/girl, man/woman tick boxes, including people who intend to change gender role completely and others whose gender identity is non-binary, to live proudly in a society that celebrates diversity.
However, their 2012 ‘Monitoring Gender Nonconformity‘ quick guide still fails to acknowledge nonbinary people in the text description, despite citing the EHRC report described above and including a version of their monitoring question. This document defines gender nonconformity with the suggested monitoring question ‘Gender Nonconformity: Does your gender identity match completely the sex you were registered at birth?’ – it nonetheless cites the EHRC ‘gender reassignment’ figure of 1% rather than the correct nonbinary-inclusive figure of 1.3%.
Hopefully, GIRES’ commitment to inclusion and celebration of nonbinary people will lead to our full inclusion in future prevalence and incidence studies and recognition that nonbinary individuals can also be and often are treated for gender dysphoria and/or ‘change their gender role completely’.
Scottish Trans Alliance: Trans Mental Health Study 2012
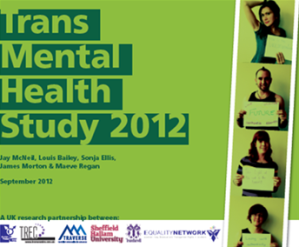 The largest nonbinary inclusive survey of UK trans people that I’m aware of was performed by The Scottish Trans Alliance in partnership with TransBareAll, the Trans Resource and Empowerment Centre, Traverse Research and Sheffield Hallam University. For approximately 3 months in mid-2012, they carried out an online survey on mental health aimed at trans people in the UK and Ireland. This was announced in trans support groups, online forums and mailing lists and was also publicised using LGBT networks and professionals whose work might bring them in contact with trans people.
Ultimately, 1045 people responded to the survey; after excluding those who lived outside the UK or Ireland, were under 18 or had not given consent to take part in research, 889 people remained as the sample used for reporting.
This was an extremely important and study resulting in a valuable and often sobering report that contains far more than just the basic demographic information explored here.
Gender was asked for with the following questions:
Which of the following best describes you?
□ I have a constant and clear gender identity as a woman
□ I have a constant and clear gender identity as a man
□ I have a constant and clear non-binary gender identity
□ I have a variable or fluid non-binary gender identity
□ I have no gender identity
□ I am unsure of my gender identity
□ Other (open text field)Do you consider yourself to be within any of the following categories?
[List of tick boxes including:
Transgender Person
Woman
Trans person
Trans woman
Man
Trans man
Female-to-Male (MtF) spectrum person
Woman with a transsexual history
Male-to-female (FtM) spectrum person
Genderqueer person
NB: only items chosen by 20% or more of respondents were included in the survey results; this list is therefore incomplete]
The results of the gender identity question (page 13), which was answered by 794 qualifying respondents, found that 65% held a ‘Constant and clear gender identity’ as a woman or a man (40% woman, 25% man), 6% answered ‘Unsure’, 3% answered ‘Other’ and 26% answered one of the options relating to a constant or variable nonbinary gender or a lack of gender identity (which could be labelled as agender or nongendered, falling under the nonbinary umbrella). The full breakdown is as follows:
| Gender Identity | Number | Percent |
|---|---|---|
| Constant and clear gender identity as a woman | 317 | 40% |
| Constant and clear gender identity as a man | 197 | 25% |
| Variable or fluid non-binary | 122 | 15% |
| Constant and clear non-binary | 63 | 8% |
| Unsure | 49 | 6% |
| Other | 25 | 3% |
| No gender identity | 21 | 3% |
| Total | 794 | 100% |
The respondents who entered ‘Other’ gave a variety of somewhat personal explanations for why they didn’t feel the other options described them. Some indicate a binary identity that’s currently personal and that they fear expressing. Others are skeptical of the concept of gender or unsure of which they qualify for. Some indicate that they’re technically genderqueer or nonbinary but use a binary gender for simplicity or for political reasons. I encourage you to read the full set of 9 examples on pages 13 and 14 of the report.
Given this breakdown, many of those who indicated ‘Other’ should be considered as identifying outside of the binary to some significant degree; however, it is clear that at least a third should in fact be considered as clearly not identifying this way. (Of course ‘Binary’ vs ‘Nonbinary’ is in itself not a binary question, categories are always more complicated than that.) This is a clear example of why a simple ‘gender ternary’ of questions such as ‘Female / Male / Other’ is of limited usefulness compared to a more inclusive set of questions.
One may conclude from these results that around 26% to 29% of trans people in the UK and Ireland identify somewhere outside the binary of man and woman. Given the example ‘Other’ responses, a conservative estimate would be to split the 3% ‘Other’ results in half and say that roughly 27.5% are nonbinary in some way.
Additionally, 21% of respondents indicated that ‘Genderqueer person’ was one of the multiple specific categories that they consider themselves to be within (no breakdown was provided to indicate how this overlapped with the answers to the gender identity question). Note, while genderqueer is sometimes used as a synonym for nonbinary or as an umbrella term for any gender outside of the binary and there is a great deal of overlap, these terms do not map perfectly onto each other with some nonbinary people not considering themselves to be genderqueer and vice versa.
Trans Media Watch: How Transgender People Experience the Media survey 2009/10
![]() Between 1st November 2009 and 28th of February 2010, Trans Media Watch asked self-identified transgender people based in the UK to complete an online survey on how they felt about representations of trans people in the media. 256 people completed the survey, 6 of whom were not themselves transgender but were a partner, significant other etc of a trans person.
Between 1st November 2009 and 28th of February 2010, Trans Media Watch asked self-identified transgender people based in the UK to complete an online survey on how they felt about representations of trans people in the media. 256 people completed the survey, 6 of whom were not themselves transgender but were a partner, significant other etc of a trans person.
Survey respondents were asked a demographic question about their ‘gender identity’ with the following options:
□ Man with a trans background
□ Woman with a trans background
□ FTM / trans man
□ MTF / trans woman
□ Cross-dressing / transvestite person
□ Androgyne / genderqueer / polygender person
□ Other type of gender variant person
□ Intersex person
□ Other (open text field)
(This question is quite poorly worded as it specifies an oddly limited set of specific identity labels. Given my experience of the community, I believe that a significant number of nonbinary people, including many agender people, would not consider that any of ‘androgyne’, ‘genderqueer’ or ‘polygender’ describe them well.)
Out of the total sample, 215 respondents answered the gender identity question. The report summarises this as:
59.5% (128) identified as female, 25.6% (55) as male, and 14.9% (32) as other (e.g. androgyne people).
The question allowed for multiple responses: 13 people answered that they were only ‘Androgyne / genderqueer / polygender person’, 13 more answered that they were only ‘Other type of gender variant person’. In total 38 people indicated they were ‘Androgyne / genderqueer / polygender person’ and 18 indicated they were ‘Other type of gender variant person’ (including 4 who dislike labels altogether). 3 people indicated they were both ‘Androgyne / genderqueer / polygender person’ and ‘Other type of gender variant person’. As such 53 out of the 211 transgender respondents held a gender identity that was in some way outside of or more complex than the binary options alone. This corresponds to 25.1% of the transgender sample.
As such, the demographics of this survey of UK transgender people found that 14.9% primarily identify as something other than female or male, and 25.1% have some form of nonbinary identity more complex than female or male alone. Although it should be noted that the question was poorly worded and was greatly improved on by the later and larger Scottish Trans Alliance survey above.
Surveys of other populations
The following surveys do not represent the UK population, or even subgroups within that population. I’ve included them in this article because they either go into greater demographic detail than UK research has yet done, pose extremely interesting research questions that have yet to be asked in the UK, or illustrate relevant points that are important to consider either when designing surveys or when talking about nonbinary gender in general.
United States National Transgender Discrimination Survey 2008
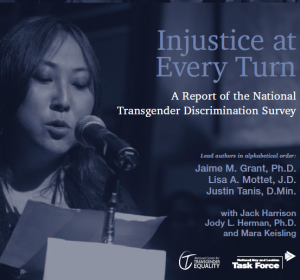 In 2008 the National Center for Transgender Equality (NCTE) and the National LGBTQ Task Force (the Task Force) launched the National Transgender Discrimination Survey studying anti-transgender discrimination in the United States. 6,450 transgender and gender nonconforming people responded to the survey over 6 months.
Gender was asked in the following way:
Q3. What is your primary gender identity today?
(A) Male/man
(B) Female/woman
(C) Part time as one gender, part time as another
(D) A gender not listed here, please specify _______
The answers to this question split as follows: 26% Male/man, 41% Female/woman, 20% Part time as one gender, part time as another and 13% A gender not listed here. It should be noted that ‘part time as one gender, part time as another’ is a description that could cover many bigender and fluid gender people and others who would consider themselves to be nonbinary or genderqueer. It could also describe binary gendered trans people who are in the process of transition or not able to present full time due to workplace discrimination or other such factors. As such it’s not possible to give a full total of people whose gender identities fall outside of binary categories based on this question.
It is unclear how surveys of United States trans populations will compare to similar surveys held in the United Kingdom, but I included this survey as an extremely valuable analysis of the ‘A gender not listed here’ respondents and the responses that were written in for option D have been published in volume 2 of the LGBTQ Policy Journal at the Harvard Kennedy School – A Gender Not Listed Here: Genderqueers, Gender Rebels, and OtherWise in the National Transgender Discrimination Survey by Jack Harrison, Jaime Grant, and Jody L. Herman.
Not only does this analysis include details of the breakdown of these write in answers, such as:
Q3 garnered 860 written responses to GNL, many of them creative and unique, such as twidget, birl, OtherWise, and transgenderist. The majority of these respondents wrote in genderqueer, or some variation thereof, such as pangender, third gender, or hybrid. Still others chose terms that refer to third gender or genderqueers within specific cultural traditions, such as Two-Spirit (FirstNations), Mahuwahine (Hawaiian), and Aggressive (Black or African American).
It also provides detailed analysis of the demographics of the ‘A gender not listed here’ respondents, their experiences of discrimination and how these compared to the rest of the National Transgender Discrimination Survey respondents. They were found overall to be younger, less likely to be white and more likely to have experienced violence and harassment. I encourage you to read the article in full and hope for similar research to be carried out in the UK in future.
European Union Agency For Fundamental Rights: EU LGBT survey 2012
 I would have dearly liked to have provided accurate Europe-wide figures for nonbinary people in this section, since there was a major European Union Agency For Fundamental Rights (FRA) survey of 93,079 LGBT people across the EU and Croatia in 2012 aimed at recording the everyday experiences of LGBT people in respect of discrimination.
However, while this research aimed to be inclusive of transgender people, it asked questions of gender and trans identity so poorly that there’s no way to determine for certain which of the transgender respondents even identify as men or women, let alone in other ways.
The questions asked were:
Question A2. What sex were you assigned at birth?
□ Female
□ MaleQuestion A3. Are / were you a transgender person?
□ Yes
□ NoOnly shown if ‘Yes’ was answered for Question A3:
PLEASE SELECT ONE ANSWER THAT FITS YOU BEST –
□ Transgender
□ Transsexual
□ Woman with a transsexual past
□ Man with a transsexual past
□ Gender variant
□ Cross dresser
□ Queer
□ Other
This set-up assumed that people with transsexual pasts, genderqueer, gender variant and nonbinary people will recognise that they are intended to be included under ‘Transgender’, which is not a reasonable assumption. This set-up also erroneously assumed that anyone who did not indicate that they were transgender was represented perfectly by the sex that they were assigned at birth. Worst of all, it apparently decided that everyone who is transgender or transsexual can have their gender determined from their assigned sex alone, as this question is never otherwise asked (alternatively, the survey designers just didn’t care – transgender people were excluded from all other categories, apparently disqualified from LGB sexualities and treated only as trans). Those who did not indicate that they were transgender were only asked their gender as assigned at birth.
The results of these deeply flawed questions do not even allow us to determine how many people who answered yes to question A3 were men or women! I, an individual nonbinary person, would not have any idea how to categorise myself given those options. I am transgender, I have a transsexual medical history, I have been categorised as ‘gender variant’ although I dislike this term, I’m queer and I’m a variety of other things such as gender neutral in identity and androgynous in presentation. I find it hard to imagine that much or any time was taken to consult with trans people about how best to represent us.
Headline results are as follows (derived from the weighted counts on pages 33 and 34 of the report):
| Answered ‘Yes’ to A3 | Count | Percent |
|---|---|---|
| 7,576 | 100% | |
| Transgender | 1,140 | 15.0% |
| Transsexual | 1,347 | 17.8% |
| Woman with a transsexual past | 409 | 5.4% |
| Man with a transsexual past | 188 | 2.5% |
| Gender variant | 575 | 7.6% |
| Cross dresser | 698 | 9.2% |
| Queer | 1,095 | 14.5% |
| Other | 2,124 | 28.0% |
It’s a clear sign that your question design is flawed when ‘Other’ is significantly higher than any other category. There was no facility offered to allow users to write in what they meant by ‘Other’. ‘Gender Variant’ and ‘Queer’ combined made up 22.0% of respondents who answered ‘yes’ to question A3. Based on the Scottish Trans Alliance survey responses for ‘Other’, we can conservatively assume that around half of the ‘Other’ responses are in some way outside of the gender binary categories, resulting in as much as 36.1% being in some way nonbinary. This is higher than other surveys of trans populations, but may reflect that a European or LGBT-focused survey will have different results. Alternatively, it may simply be because this survey was extremely flawed when handling gender.
Later in the survey, everyone was asked if they feel either masculine or feminine (as another binary-only option) and if they look either masculine or feminine, and then this was compared to assignment at birth to decide if they had a ‘matching gender expression’ or not (this is equally flawed, one can be extremely gender nonconforming in expression while still being ‘matching’ by this definition, and one can be androgynous, epicene or neuter, or simply not relate to the binary of ‘feminine’ or ‘masculine’). Those who answered that they were transgender in question A3 were found to be almost equally ‘matching’ and ‘non-matching’ by these questions.
To conclude, this FRA research was deeply flawed and represents an extremely disappointing failure to design what could have been a groundbreaking survey in a way that was inclusive of gender minorities. This highlights the importance of taking care to be inclusive of trans people and those who don’t fit within the gender binary. It is recommended that an inclusive consultation process, such as that carried out by the EHRC, be completed before designing a survey such as this.
[Note, other EU publications, such as the European Commission Trans and intersex people: Discrimination on the grounds of sex, gender identity and gender expression report, are more inclusive of nonbinary experiences and identities but don’t provide figures relevant to this report.]
The AVEN Community Census 2014
![]() The Asexual Visibility and Education Network, AVEN, hosts one of the largest forum communities for asexual people (those who do not experience sexual attraction) and their supporters. Earlier this year the AVEN membership were surveyed in a Community Census; the survey was also promoted on social media outlets such as Tumblr, Facebook, Reddit and Twitter as well as on other online asexual community groups. The survey was online and self-selected and received a total of 14,210 responses, 10,880 of which were from respondents who were asexual, demisexual or grey-asexual.
The Asexual Visibility and Education Network, AVEN, hosts one of the largest forum communities for asexual people (those who do not experience sexual attraction) and their supporters. Earlier this year the AVEN membership were surveyed in a Community Census; the survey was also promoted on social media outlets such as Tumblr, Facebook, Reddit and Twitter as well as on other online asexual community groups. The survey was online and self-selected and received a total of 14,210 responses, 10,880 of which were from respondents who were asexual, demisexual or grey-asexual.
AVEN’s membership is in no way a reflection of the United Kingdom’s population, in fact only 9% of respondents identified themselves as coming from the UK. Its membership is also very skewed towards younger people, in part due to being primarily used by people who are newly exploring their asexual spectrum identity. However, the results of this survey are notable as the AVEN membership contains an unusually high proportion of nonbinary members. As in previous surveys of membership, nonbinary individuals outnumber men in the 2014 AVEN Community Census – 62.1% were women, 24.6% were nonbinary and 13.3% were men.
Based on previous findings, it has been assumed that there was a strong overlap between nonbinary gender and asexual orientations; however, this survey found there were almost as many nonbinary individuals among the allosexual (non-asexual) respondents – 26.1% of asexual spectrum respondents vs 20.9% of allosexuals. This may imply that the large proportions of nonbinary people may be in some part due to the inclusive and safer space AVEN offers to those who experience gender outside of the binary. (As the original author of the AVEN asexuality FAQ in 2002, I can report that the forums were extremely nonbinary-friendly and open to and supportive of questioning of gender from the beginning.)
The gender questions were posed in the following way:
20. What sex were you assigned at birth?
i.e. What was written on your birth certificate
Mark only one oval.
⬭ Male
⬭ Female
⬭ Other: ______________21. Have you ever been officially diagnosed with an intersex condition?
Mark only one oval.
⬭ No
⬭ Yes
⬭ Other: ______________22. Which of the following best describes your current gender identity?
Mark only one oval.
⬭ Man/male
⬭ Woman/female
⬭ Other (see below)23. If you chose “other” on the previous question, which of the following best describes
you?
Mark only one oval.
⬭ I did not choose “other”
⬭ Genderqueer
⬭ Neutrois
⬭ Agender
⬭ Bigender
⬭ Other: ______________24. Do you consider your gender identity fluid?
Mark only one oval.
⬭ Yes
⬭ No
⬭ Unsure25. Do you consider yourself trans?
Mark only one oval.
⬭ Yes
⬭ No
⬭ Unsure
Results for question 23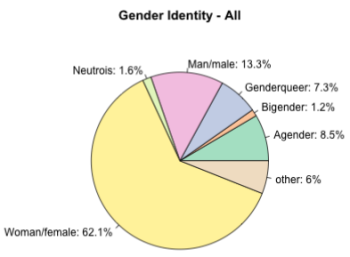 were:
were:
| Gender Identity | Percent |
|---|---|
| Woman/female | 62.1% |
| Man/male | 13.3% |
| Agender | 8.5% |
| Genderqueer | 7.3% |
| Neutrois | 1.6% |
| Bigender | 1.2% |
| Other | 6.0% |
It’s likely that agender people are overrepresented within the asexual community compared to other populations, as this is a high figure compared to the Trans Mental Health survey results for ‘No gender identity’. However, it’s also likely that agender individuals are also to some degree underrepresented within trans communities.
The primary reason for including the AVEN Census in this article was their inclusion of the question ‘Do you consider yourself trans?’. There is often controversy within trans and nonbinary communities over who qualifies as trans and whether it’s necessary to clarify the word with an asterisk (trans*) in order to denote inclusion of all gender variance. Of the individuals who identified as a gender other than man or woman, 31.4% considered themselves trans, 41.0% did not consider themselves trans and 27.6% were unsure. The 2014 AVEN Community Censis: Preliminary Findings report correctly highlights that:
This is an important cautionary finding for future research on asexual and nonbinary populations, as it makes it clear that asking about trans identity is not a equivalent to asking about both assigned sex at birth and current gender identity.
This finding should be taken into account when considering the surveys of trans populations above and is supported by the findings of the EHRC study, which found 31.6% of nonbinary individuals feeling they qualified for the ‘gender reassignment’ protected characteristic.
Results are not yet available on how many people have fluid gender identities, nor how the various nonbinary identities corresponds to other demographic questions.
Nonbinary Stats Survey 2013
In May 2013, nonbinary activist Cassian Lodge compiled an online self-selected survey aimed at nonbinary/genderqueer people asking statistic-gathering questions. This was promoted through Tumblr and other relevant social media outlets such as Twitter and Reddit, all of which have international reach. No supplementary demographic questions were asked. 2,061 people responded to the survey.
The gender question was asked as:
How do you describe your gender?
Tick all that apply
□ Agender
□ Androgyne
□ Bigender
□ Fluid gender
□ Genderqueer
□ Intergender
□ Neutral
□ Neutrois
□ Nonbinary
□ Third Gender
□ Trans*
□ Transgender
□ Unknown
□ Other: ______________
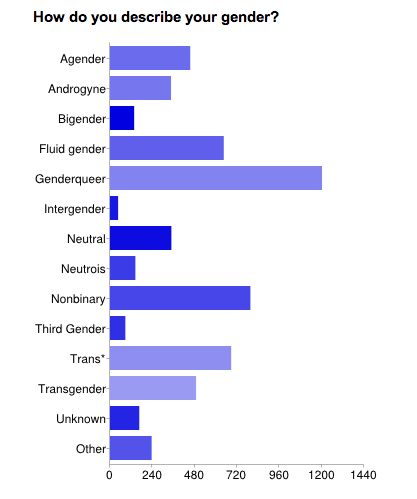 The results were as follows:
| Gender | Percent |
|---|---|
| Genderqueer | 58% |
| Nonbinary | 39% |
| Trans* | 33% |
| Fluid gender | 31% |
| Transgender | 24% |
| Agender | 22% |
| Neutral | 17% |
| Androgyne | 17% |
| Other | 11% |
| Unknown | 8% |
| Neutrois | 7% |
| Bigender | 7% |
| Third gender | 4% |
| Intergender | 2% |
The 236 “other” options were either left blank or were words that only came up once or twice, such as “ambigender” and “femme” and “transmasculine”.
These results illustrate the diversity of identities among individuals active in online nonbinary and genderqueer communities. As in the Trans Media Watch survey, many respondents gave multiple descriptions of their gender when allowed to.
This also demonstrates that those who qualify for umbrella labels such as ‘nonbinary’, ‘trans*’ or ‘transgender’ may not describe themselves in that way, despite recognising that they are included within these categories.
I would welcome future surveys of online nonbinary communities with a similar range of demographic questions to those found in the AVEN Community Census and US National Transgender Discrimination Survey.
Tel-Aviv University: Queering gender: studying gender identity in ‘normative’ individuals 2013
 This last research paper by Daphna Joel, Ricardo Tarrasch, Zohar Berman, Maya Mukamel and Effi Ziv doesn’t relate to the UK at all but was instead the result of research from Tel-Aviv University and the University of Haifa in Israel. I’ve included this study as a ‘wildcard’ because, rather than studying the general population or the trans population, it aimed to study gender identity in ‘normative’ or apparently cisgender individuals.
In the broadest terms, this study can be seen as a gender identity equivalent of the famous Kinsey Report on sexual orientation and may be the first to apply the types of gender identity research questions asked of gender dysphoric and gender nonconforming individuals to the wider population.
Participants were recruited through online invitations to various university departments, via the Israel National LGBT Task Force and other activists in the queer community, via professionals who worked with transgender individuals and via posts on the researchers’ Facebook pages. 2,225 people responded. The surveys took place online. The participants were initially asked for both ‘sex’ and ‘gender’ in terms of ‘Female’, ‘Male’, ‘Transgender’ and ‘Other’.
The study focused on the 570 ‘normative’ men and 1585 ‘normative’ women who answered indicating matching ‘sex’ and ‘gender’. Those who answered as ‘Other’ for either sex or gender, those whose ‘sex’ and ‘gender’ did not match, and those who indicated that they were transgender were split out from the main study population and are referred to in the report as the ‘Queer’ group. In total 17 individuals answered that their ‘sex’ was other, 36 individuals that their ‘gender’ was other, 10 individuals had a different ‘gender’ to their ‘sex’ and 18 individuals indicated that they were transgender. There was some overlap in these categories. In total there were 70 individuals in the ‘Queer’ (non-normative / transgender) group, accounting for 3.1% of people in the study.
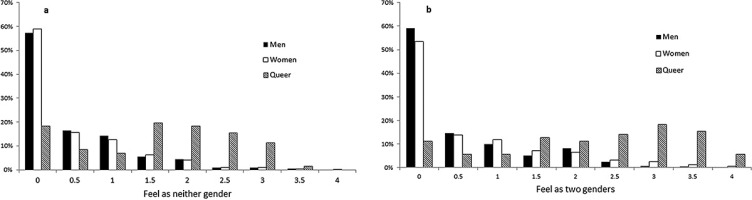
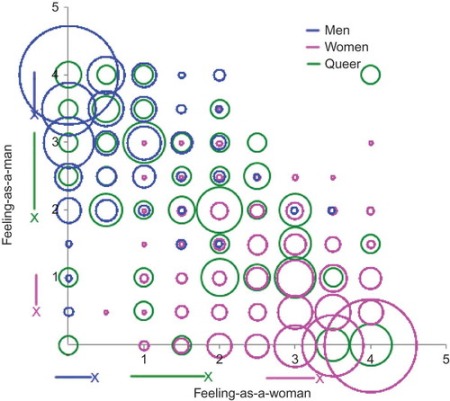 To assess gender identity, they were all asked to rate how frequently they felt like a man, how frequently they felt like a woman, how frequently they felt like both and how frequently they felt like neither. Over 35% of the ‘normative’ individuals studied responded that they felt to some extent as the other binary gender, as both men and women and/or as neither. It was found that these feelings were more prevalent and on average stronger among the ‘Queer’ (non-normative / transgender) participants but that:
the range of scores for all measures of gender identity was highly similar in Queers and non-Queers. A similar pattern was obtained for measures of gender dysphoria and gender performance.
 The study participants were also asked questions about perception of gender as performance (how frequently they felt that they have to work at being a man or a woman), gender performance/conformance (how frequently they wore clothing intended for the other binary gender and used gendered language for the other binary gender) and gender contentment (answering a version of a standardised test for measuring gender dysphoria in trans individuals, but with value judgements about answers removed from the questions). Women were slightly more likely to perceive gender as performance and significantly more likely to shop from the male side of the store. There were low but non-zero levels of gender dysphoria in the ‘normative’ participants and no relationship was found between sexual orientation and dysphoria.
As is usually the case for gendered traits, there was enough overlap between the gender identities of men and women that some ‘normative’ men felt like women more often than some ‘normative’ women and vice versa. It was found that non-heterosexual people were no less likely to feel like their affirmed gender but were more likely to also feel like the other binary gender, like neither binary gender or like both. Non-heterosexual participants were also a little more likely to perceive gender as performance and more likely to not conform to gendered clothing restrictions.
This is a far more nuanced model of gender than any of the other studies and polls above provide, asking for frequency of feelings across multiple axes. It would appear that the more nuanced and detailed the gender questions, the more likely it is that simplistic binary models of gender break down and a more complex view of the diversity of gender experiences is revealed for a larger number of people.
Despite this nuance and complexity, the study authors acknowledge that they have still limited and simplified gender by asking their questions solely in terms of ‘man’ and ‘woman’ (and combinations or lack thereof). Gender is more diverse than this and future studies could be designed to reflect this. The study authors also recognise that the participants were entirely Israeli and primarily Jewish. As such they are now running a similar survey aimed at a more ethnically and religiously diverse population to find if the same patterns still apply.
This is extremely detailed and interesting research and I encourage you to read the paper in full rather than relying on my summary.
It would be extremely interesting to see this or similar research performed in the UK. I would also welcome a repeat of this research with a large enough non-normative / transgender group that individual subgroups, such as those who indicated that they were nonbinary or binary trans in the basic ‘sex’ and ‘gender’ questions, could be studied and compared individually rather than grouped into a single ‘Queer’ group.
However, it should be noted that ‘feeling like’ a gender is not the same as considering oneself to be of that gender, or wishing to have that gender affirmed. The majority of the ‘normative’ participants in the study were mostly content with their affirmed genders as men and women, although a larger minority considered them to be to some degree performative. Within the 35% who experienced nonbinary feelings are a smaller group who would be likely to claim nonbinary identity were this more widely accepted and understood, but this is almost certainly a considerably lower proportion than 35%. Additionally, the surveys above that allowed multiple gender labels to be selected showed that greater proportions chose nonbinary identity labels when these could be selected in addition to man or woman. As such, some of the individuals labelled as ‘normative’ may have already identified as genderqueer, bigender, fluid-gender or some other label under the nonbinary umbrella.
Summary, analysis and recommendations
How the question of gender is asked affects how many people will respond in ways that fall outside of binary classification. Making it clear that you’re asking how the person describes or defines themself will give a more accurate answer than phrasing the question in a way that could be interpreted as asking for gender assigned at birth, legal status, body configuration or even just the ‘best fit’ binary option. I would recommend explicitly including the invitation to describe gender in another way to the binary options.
Even asking the question in terms of ‘Man’, ‘Woman’ or ‘Other’ is likely to produce a larger number of nonbinary responses than ‘Female’, ‘Male’ or ‘Other’. It is not uncommon for people to identify with the ‘sex’ assigned to the body and/or the role placed upon them in society, but to consider their gender to be something more complex. Asking for ‘Other’ in the context of ‘Female’ and ‘Male’ is likely to reduce the number of people identifying outside of the binary to the lowest possible figure, those who feel strongly enough to reject classification with binary ‘sex’ as well as the man/woman binary (this will be even more so if distinction from gender assigned at birth isn’t established first). As such, I would recommend amending the the EHRC’s monitoring question to ‘Which of the following describes how you think of yourself? Man, Woman or In another way (please specify)’.
Based on the Equality and Human Rights Commission’s large scale survey, 0.4% of the UK population feel strongly enough about not being female or male to describe their gender in another way, that’s about 1 in every 250 people. The gender self-descriptions that these people wrote in indicate that they mostly hold specific nonbinary identities such as genderqueer, genderless, gender-fluid etc. 0.4% is likely the most conservative estimate for the number of nonbinary people in the UK, but may reflect the numbers who would pursue some form of nonbinary legal status. This figure is consistent with the number of people who skipped, multi-ticked or spoiled the ‘sex’ question in the last 2 UK Censuses, although the census data should be considered highly unreliable for determining gender identity. When combined with the overlapping EHRC figure of 1% of the population qualifying for ‘gender reassignment’ protection, at least 1.3% of the UK population is in some way transgender or gender variant, of which 30.2% are nonbinary.
Surveys of the UK trans and gender variant population (those active in online communities or in contact with service providers) found that around 25 to 28% of trans people identify in ways that can’t be described by the binary options alone. Higher proportions will respond in these terms if there is the option to select multiple answers in describing a single person’s gender and/or there is acknowledgement of fluid-, bi- and polygender experience. The Trans Media Watch survey had a much lower proportion of those choosing a nonbinary classification once those who had also responded that they were a man or woman had been discounted (14% vs 25%). All surveys allowing multiple choices found a diversity of different overlapping identities. As such, it is recommended that gender questions should allow multiple answers from a list of common nonbinary identities, including genderqueer, genderfluid, agender etc, as well as the ability to write in additional self-descriptions. This should be a separate question to the choice of ‘Man, Woman or In another way’.
Where possible, avoid asking gender questions in terms of a limited set of specific nonbinary identities or in terms of a single umbrella term. Only a minority of people who describe themselves in another way to ‘a man’ or ‘a woman’ would recognise that they are included in ‘Are you nonbinary?’ or even the longer established ‘Are you genderqueer?’, fewer still if the question phrased such as ‘Are you non- or bi-gendered?’ or ‘Are you an Androgyne / Genderqueer / Polygender person?’ etc, but the intention is to record all who identify as something other than (or more than) a man or a woman.
Some respondents to the Trans Mental Health survey indicated that they presented a more normative and binary view of their gender experience to gender professionals out of fear of being denied access to healthcare or services. This is a commonly expressed fear within nonbinary community forums and likely results in gender professionals having a much more conservative view of the number of nonbinary and genderqueer individuals they work with.
However, it is important to be aware that, in 3 different surveys, only around 31% of those identifying outside of the gender binary considered themselves to either definitely be ‘trans’ or to fit the description of the ‘gender reassignment’ protected characteristic. This shows that a majority of nonbinary people are not protected by the Equality Act 2010’s provisions for gender minorities and that, despite advocating strongly for ‘trans’ and ‘transgender’ to be inclusive of all gender minorities, it is necessary to explicitly and prominently include nonbinary people in order for all to feel welcome.
Do not assume that surveys of trans people will be fully representative of nonbinary populations, or that nonbinary people will (or won’t) consider themselves to be trans. It is likely that some nonbinary people will consider themselves to be both or neither of transgender and cisgender, or to be trans in some ways but not in others. Some may consider themselves to be trans* but not trans, or transgender but not trans (or vice versa). Others very strongly claim their transgender identity and defend their place in the trans community. Do not define trans or transgender in ways that exclude nonbinary people and do not assume that there isn’t overlap between those who experience dysphoria and transition and those who experience gender in ways that can’t be described by a gender binary.
If you are designing a survey or study and wish to be inclusive of nonbinary people, it is recommended that you consult with members of various nonbinary, genderqueer, trans and gender nonconforming communities in order to ensure that your questions do not inadvertently exclude, erase, make assumptions about or outright offend some members of those groups. The EHRC performed a consultation and workshopping process when designing their recommended gender monitoring questions that may be a useful guide to those conducting future research. Badly designed survey questions making poor assumptions can prevent many gender variant people from answering relevant questions, or even make it impossible to determine exactly how many people are men or women, let alone nonbinary, as the EU LGBT survey illustrated.
I would like to encourage future surveys and studies of the nonbinary population to ask and report on a range of other demographic questions similar to those asked in the United States National Transgender Discrimination Survey 2008. UK research covering nonbinary gender has yet to reveal the kinds of useful insights provided in the American study, although the Trans Mental Health study has made a start towards this.
The majority of the research presented above highlights people who actively identify outside of the gender binary. Figures highlighted show how many people think of themselves as something other than men or women, or as something in addition to being a man and/or woman. It is important to recognise that there is a wide diversity of different, varied and complex experiences under the umbrella term ‘nonbinary’. This should not be treated as a ‘ternary gender system’, simply adding one more ‘nonbinary’ option as an extension to the binary. Nonbinary people are not a homogenous group and knowing that someone is ‘nonbinary’ alone tells you very little about how that person experiences and expresses gender.
Currently there is limited public awareness of nonbinary gender, with around three quarters firmly believing in a binary system of only men and women. The Israeli ‘Queering Gender’ study found that over a third of those who do not identify as trans or gender variant nonetheless have experiences and feelings of gender that defy classification within a rigid binary system, with those participants feeling like the other binary gender, both binary genders and/or neither binary gender to some significant degree. This may indicate that greater public understanding and acceptance of nonbinary gender would lead to more individuals recognising that they are not well described by ‘man’ or ‘woman’.

Thank You, a very interesting report. I will take some time to read and digest all this information. Thanks for gathering it all in one place
LikeLike
Re-reading this after a long time, I note, as Chair of Trans Media Watch, how much the demographic of our supporters has changed. Were we to re-run a survey like the one we ran in 2010, described above, I would expect that a considerably high proportion of respondents would identify outside the binary. We were founded in 2009 so were still a young organisation in 2010, and, like many young trans organisations, we had drawn a lot of our support from existing online trans communities, which tended at the time to be heavily weighted towards trans women.
Now, in 2017, we have a much broader support base and our day to day engagement with out supporters suggests that around a third are non-binary in one way or another. We also encounter very little hostility toward non-binary people from binary trans people, whereas we used to encounter quite a lot. It may well be the case that non-binary people are now more likely to engage with trans organisations because they feel more welcome under the transgender umbrella.
LikeLiked by 1 person